How to dive
Scratch
Scratch window is a scratch notebook of code snippets similar to emacs *scratch* buffer.
You can open, close, and save the script file in the buffer.
You can also debug the code in the following step:
-
In Scratch window, select the buffer you want to debug.
-
Pressing [M-j] compiles the code and evaluates it in the currently selected shell namespace. The code "
" now can be referenced from the debugger of the shell. -
Then, you can debug the code using :ref:
command-hookand :ref:trace-hookas well as the Log window.
Key bindings of Scratch::
C-x C-o     : open
C-x C-s     : save
C-x S-s     : saveas
C-x C-l     : load
C-x C-k     : kill-buffer
C-x k       : kill-all-buffers
C-x C-n     : new-buffer
M-j         : exec-buffer
C-j         : eval-line
Magic syntax
Nautilus shell accepts some magic syntaxes e.g.,
>>> x`y
# interpreted as (quoteback):
# ==> y=x

>>> x@y
# interpreted as (pullback):
# ==> y(x)
For example,
>>> 5 @range @list @p
[0, 1, 2, 3, 4]
In Ruby, one of the popular programming languages, you can chain methods like this:
irb> p 5.times.to_a
[0, 1, 2, 3, 4]
Note that in contrast of Ruby, it can also chain p (print) function.
Actually, it can chain not only methods but also any functions as follows:
>>> buf @io.BytesIO @Image.open @np.asarray @plt.imshow; plt.show()
# interpreted as:
==> plt.imshow(np.asarray(Image.open(io.BytesIO(buf)))); plt.show()
.. seealso::
The name "pullback" comes from mathematical terminology.
Pullback is like a mathematically defined synonym of substitution.
https://en.wikipedia.org/wiki/Pullback
Built-in utilities
Nautilus has some useful functions in builtin module::
@p          Synonym of print.
@pp         Synonym of pprint.
@info       Short info.
@help       Full description.
@load       Load file in Log buffer.
@where      Displays filename:lineno or the module name.
@mro        Displays mro list and filename:lineno or the module name.
@dive       Clone the shell with new target.
@debug      Open pdb or event-monitor.
@timeit     Measure the duration cpu time (per one execution).
@profile    Profile a single function call.
@filling    Inspection using ``wx.lib.filling.Filling``.
@watch      Inspection using ``wx.lib.inspection.InspectionTool``.
p(print) / pp(pprint) / filling
>>> self.shell.handler @p
# Display shell key bindings.
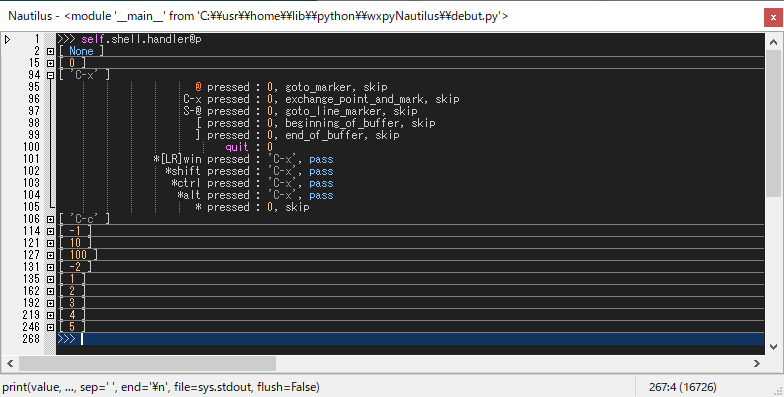
The special object handler is like DNA, defining how the object interact in a process. In fact, it is a simple dictionary of Finite State Machine (FSM) that maps states to transitions and actions.
In this case, ['C-x'] state has the key-event ['@ pressed'], thus two-stroke typing [C-x @] invokes goto_marker which moves the caret to the marker (o) position.
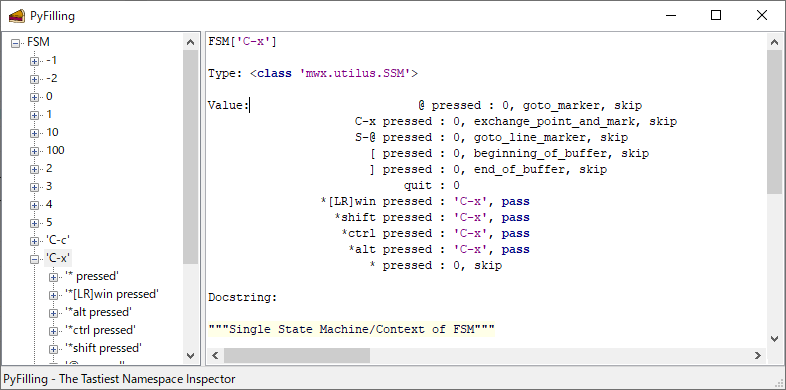
You can also use fancy view of the key bindings using PyFilling window.
>>> self.shell.handler @filling
# Show shell key bindings in ``PyFilling`` window.
where / load / mro
The command where is used to find the source code.
>>> self.shell @where
# Displays the source code filename:lineno.

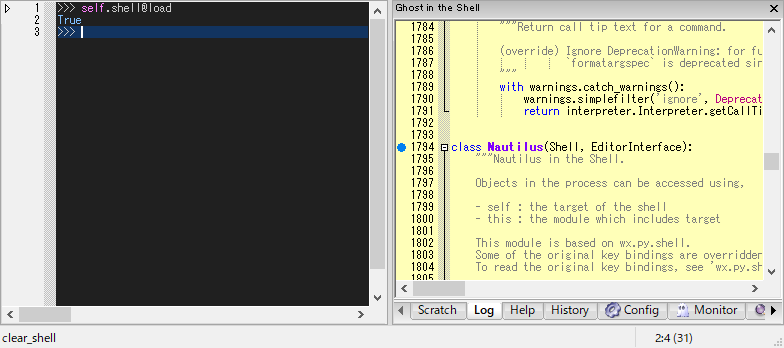
Default Log window can be used to open the file.
>>> self.shell @load
# Loads the source code in **Log** window.
If you like to open the file with your editor, define a function edit('filename:lineno') somewhere such as 'PYTHONSTARTUP' script file. Then, you can open the file like this:
>>> self.shell @where @edit
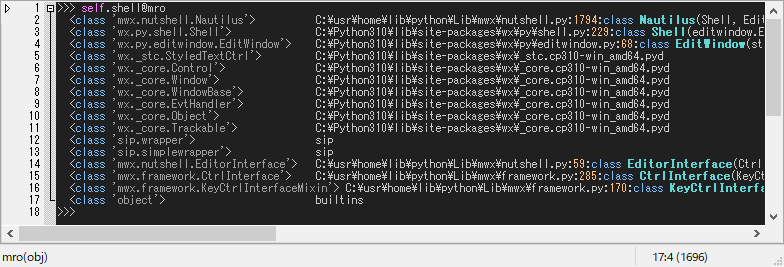
The command mro displays mro list of the object with filename:lineno.
You can grep those files if exist, using [f10]: grep-forward, [S-f10]: grep-backward.
>>> self.shell.handler @mro
# Displays mro list and filename:lineno or the module name.
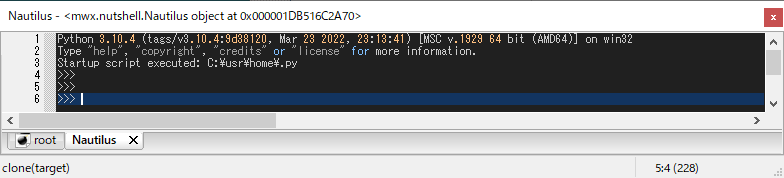
dive
The command dive is equiv. to rootshell.clone which creates a new shell with the specified target in the new page.
>>> self.shell @dive
# Clone the shell with the specified target.
# In this case, that target is the ``rootshell<Nautilus>`` itself.