How to debug
command-hook
In command-hook mode, you can specify the function to debug in the shell prompt.
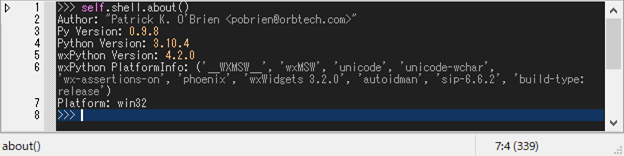
Here, we take the shell function about() as an example.
>>> self.shell.about()
To enter debug mode, type @debug after the normal function call:
>>> self.shell.about() @debug
Key bindings for debugger::
C-g     : quit
C-q     : quit
C-n     : next   (step-over)
C-s     : step   (step-in)
C-r     : return (step-out)
C-b     : set a breakpoint at the current line.
C-@     : jump to the first-lineno of the code.
After exiting debug mode, you can check the stack frames::
f10     : grep frame forward
S-f10   : grep frame backward
If you want to view the code, right click Log tab and select the file.
If you want to view the debugging log, select *log* buffer.
trace-hook
In trace-hook mode, you can specify the function to debug in Log window.
-
Select the file in Log window. If the file is not found, it can be loaded by placing the cursor on the target and pressing [f2].
>>> function| ^ Press [f2] to load the file in **Log** window where the function is defined. -
Press [C-S-space] in Log window to set a trace pointer (=>) where you want to break at.
Note
The system is about 2-3 times slower while tracing. To quit tracing, press [C-g].
-
If the system reached the breakpoint, the root shell enters debug mode.
Note that the debugger doesn't stop until it reached the bottom frame, in this case, shell input frame.
Since the shell input is executed in the mainloop i.e., the main-thread, it will enter EVT_IDLE handler endlessly. In this case, press [C-g] to exit the debug mode.
event-hook
In event-hook mode, you can specify the event handler to debug in Monitor window.
-
Move to Inspector window.
-
Right-click the target widget and select [Watch the event] menu. Then, it starts monitoring wx events.
-
Tick the checkboxes of the events you want to hook. Blue string indicates that the event handler is user-defined and hookable.
-
When the event is fired and the handler is called, the current shell enters debug mode.
Note
Since ver 0.75, monitor and inspector windows will be included in the watcher window.
Tip
Press [F11] to show ghost window containing buffer/editor, monitor, and inspector windows. Press [S-f11] to show the watcher window containing globals and locals lists.
Key bindings for the shellframe::
f11     : toggle_window<'Toggle ghost'>
S-f11   : toggle_window<'Toggle watcher'>